 Open Tech Calendar Blog
We list virtual tech events that include community participation
One of the principal ideas behind Open Tech Calendar was that we could build a community of users all adding events for the good of everyone. We've been around a bit now, so can we break out some data to see if that's actually worked?
Let's start with a graph of all the users who have edited events, and how many edits they have made.
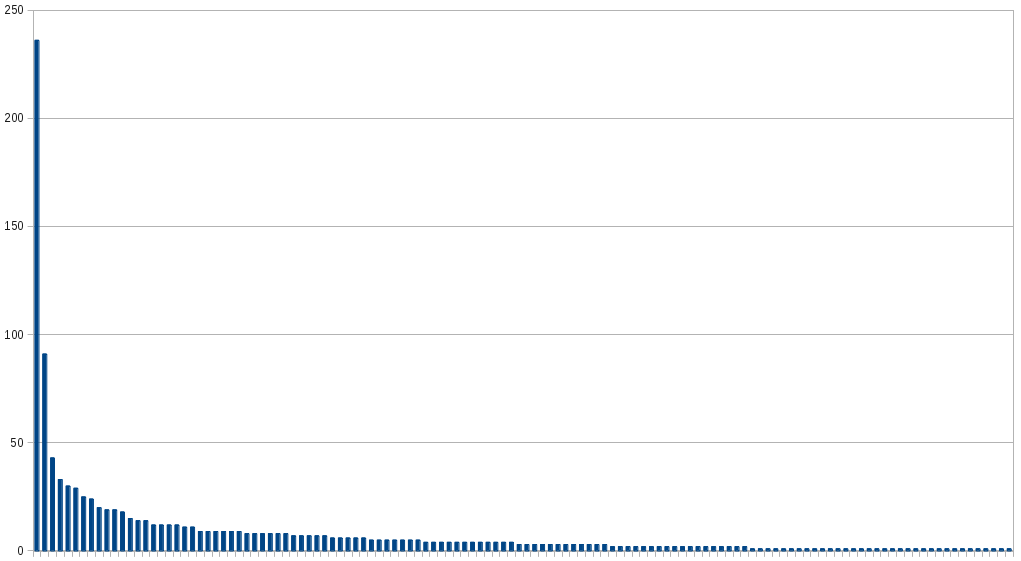 That looks pretty good! But wait, there is a catch. One user who edits the same event 5 times will have a higher count in this data, and you could argue that's not a fair representation. Ok - let's get a graph of each user and how many events they have edited.
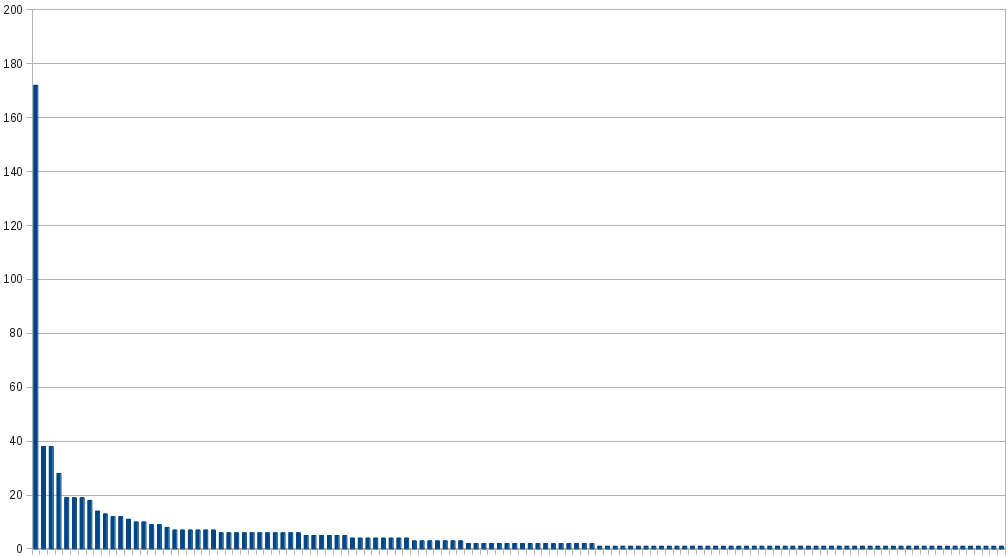 Check that out: Still pretty good. We clearly have a healthy and wide community of users editing events.
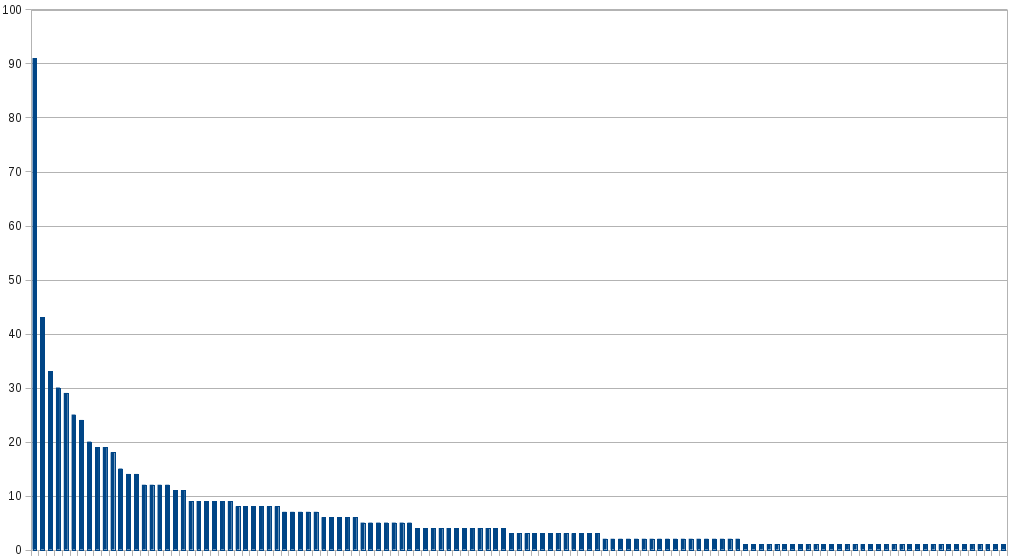
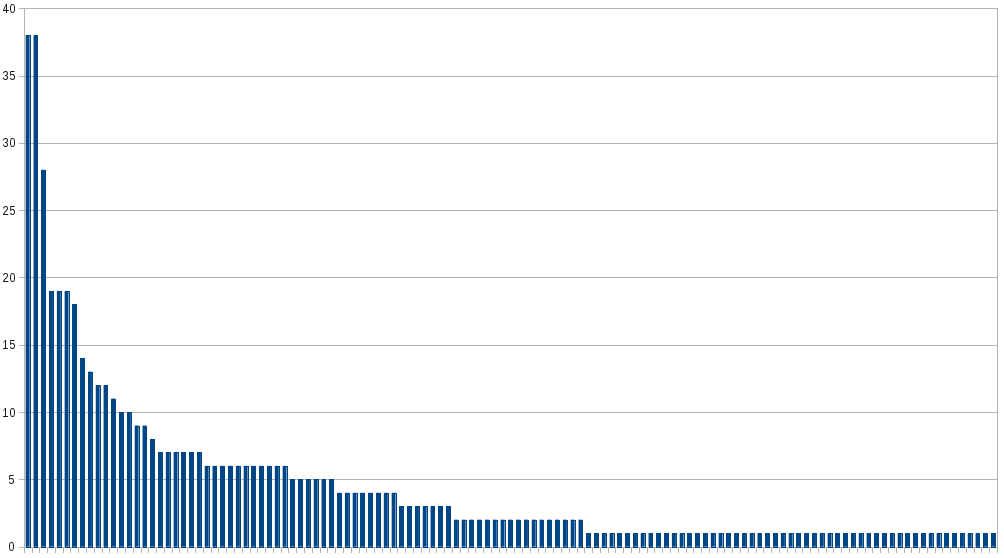
Even thought you can look up history data on the site to work out who everyone is I haven't labelled any users. But we can probably guess who the one on the left is - it's the site administrator. Let's call them a outlier and take them out - that will give us a bit more detail on the rest of the data.
No of edits made:
No of events edited:
This is a slightly simplistic analysis. We aren't counting edits to groups. We aren't counting events from importers, and edits to importers. There are some questions about the best way to include that data, so for now we'll keep it simple and let the data speak for itself.
Thanks to everyone who has added an event - it really helps build up a great resource. And if you haven't, give it a try - it's pretty easy!
Published: 2013-10-21